
A traditional chart is what most will call either a navigation or contour chart or more accurately, a structure chart highlighting river channels, creeks, humps, islands, ledges, points etc. A FishTec chart has everything a contour chart has, but adds the real game changer – cover. Cover is what is on the structure, such as rocks, timber and man-made cover such as roads, foundations, foot paths, bridges, sunken boats, etc. FishTec uses a multitude of resources and tools to include on the charts to help get you on a winning pattern on the best spots a body of water has to offer in the least amount of time.
The table below is a list of what can be found on a FishTec chart.

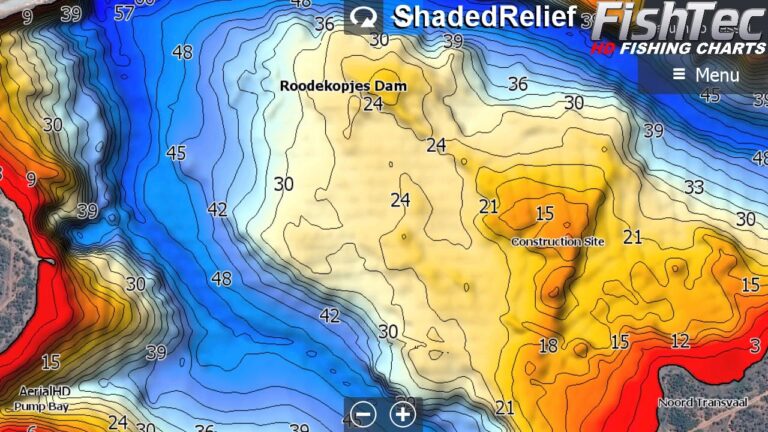
Contour or depth vector data is the fundamental basis of any chart. What makes FishTec contours overlay stand out from any other contour chart is the accuracy gained from an extremely low interpolation value when rendering the chart. This can only be achieved due to the quality of the depth data gained from precision surveys using a high-performance Autonomous Survey Craft (ASC).

From the contour depth data, a shaded relief raster image is created, giving a low-resolution 3D effect to visually represent the elevation and shape of the bottom structure by using multiple colours and shading.
Sediment charts are typically paper charts created by the Government Department of Water Affairs, which FishTec sourced in digitised form. Depending on the quality of the sediment chart, these offer anglers more valuable information about old roads, bridges, building foundations, paths and many other points of interest that were in existence prior to the area being flooded to create the dam. On selected sediment charts, FishTec has added a colour spectrum overlay representing depth, making it easy to read.

Satellite charts, especially low-level imagery such as when a body of water was experiencing a low water level or drought, have become very popular amongst anglers. The biggest issue with satellite imagery is when the resolution is poor, especially when zoomed in on a chart plotter.

Sidescan ultra high frequency (UltraHF) sonar is a life-like representation of the bottom created by using high frequency sonar, which has forever changed the way anglers can identify key cover such as rocks, timber and man-made cover such as roads, foundations, foot paths, bridges, sunken boats, etc. A sidescan mosaic, while being the Holy Grail of fishing charts, is by far the most challenging chart to collect data for, as it requires a multitude of techniques in order to produce a quality final product. Since 2009, FishTec has been developing techniques such as ShadowMax and ZeroNadir, and high-performance tools such as the ASV named ‘AIMy’, which together can confidently claim FishTec to be an industry leader in the world.

This low water level imagery is collected with a drone, giving detail up to twenty times of that of your average satellite imagery

Using the Aerial imagery, a form of light distance ranging is used to create a 3D-like contour chart. Even with very slight depth and height variations, anglers can clearly identify the difference between a hump and a hole.

The georeferenced image viewer makes it possible to view photographs directly off the chart on your unit by simply clicking on the photo reference numbers in the area you are interested in fishing. Our newer chart updates include a PDF QuickView option.

FishTec uses cookies to provide a better browsing experience. View our Privacy Policy to learn more.